Mathematical Models ��A Mathematical Model is a description of a system using mathematical concepts and language. The process of developing a mathematical model is termed mathematical modelling. Mathematical models are used not only in the natural sciences (such as physics, biology, earth science, meteorology) and engineering disciplines (e.g. computer science, artificial intelligence), but also in the social sciences (such as economics, psychology, sociology and political science); physicists, engineers, statisticians, operations research analysts and economists use mathematical models most extensively. A model may help to explain a system and to study the effects of different components, and to make predictions about behavior.


Mathematical Models can take many forms, including but not limited to dynamical systems, statistical models, differential equations, or game theoretic models. These and other types of models can overlap, with a given model involving a variety of abstract structures. In general, mathematical models may include logical models, as far as logic is taken as a part of mathematics. In many cases, the quality of a scientific field depends on how well the mathematical models developed on the theoretical side agree with results of repeatable experiments. Lack of agreement between theoretical mathematical models and experimental measurements often leads to important advances as better theories are developed.


Statistics is the study of the collection, organization, analysis, interpretation and presentation of data. It deals with all aspects of data including the planning of data collection in terms of the design of surveys and experiments.


The word statistics, when referring to the scientific discipline, is singular, as in "Statistics is an art." This should not be confused with the word statistic, referring to a quantity (such as mean or median) calculated from a set of data whose plural is statistics ("this statistic seems wrong" or "these statistics are misleading").


Statistics is alternately described as a mathematical body of science that pertains to the collection, analysis, interpretation or explanation, and presentation of data, or as a branch of mathematics concerned with collecting and interpreting data. Because of its empirical roots and its focus on applications, statistics is typically considered a distinct mathematical science rather than as a branch of mathematics.� Some tasks a statistician may involve are less mathematical; for example, ensuring that data collection is undertaken in a way that produces valid conclusions, coding data, or reporting results in ways comprehensible to those who must use them.


Statisticians improve data quality by developing specific experiment designs and survey samples. Statistics itself also provides tools for prediction and forecasting the use of data through statistical models. Statistics is applicable to a wide variety of academic disciplines, including natural and social sciences, government, and business. Statistical consultants can help organizations and companies that don't have in-house expertise relevant to their particular questions.


Statistical methods can summarize or describe a collection of data. This is called descriptive statistics. This is particularly useful in communicating the results of experiments and research. In addition, data patterns may be modeled in a way that accounts for randomness and uncertainty in the observations.


These models can be used to draw inferences about the process or population under study�a practice called inferential statistics. Inference is a vital element of scientific advance, since it provides a way to draw conclusions from data that are subject to random variation. To prove the propositions being investigated further, the conclusions are tested as well, as part of the scientific method. Descriptive statistics and analysis of the new data tend to provide more information as to the truth of the proposition.


"Applied statistics" comprises descriptive statistics and the application of inferential statistics.[9][verification needed] Theoretical statistics concerns both the logical arguments underlying justification of approaches to statistical inference, as well encompassing mathematical statistics. Mathematical statistics includes not only the manipulation of probability distributions necessary for deriving results related to methods of estimation and inference, but also various aspects of computational statistics and the design of experiments.


Statistics is closely related to probability theory, with which it is often grouped. The difference is, roughly, that probability theory starts from the given parameters of a total population to deduce probabilities that pertain to samples. Statistical inference, however, moves in the opposite direction�inductively inferring from samples to the parameters of a larger or total population.


Statistics has many ties to machine learning and data mining.

The course materials listed on this web site are copy rights � by the subject authors and publishers. They are solely intended for classroom teaching and online reference. Copy and/or redistribution of these contents are prohibited by the US copyright law.


-Math & Calculus Topics:

-

1-Calculus for Scientist and Engineers

2-Mathematical Modeling

3-Computer Graphics: Principles and Practice

4-Statistics for Business Decision Making & Analysis

5-Exercise pdf -

-

-

1-Calculus for Scientist and Engineers

1-Functions

2-Limits

3-Introducing the Derivative

4-Applications of the Derivative

5-Integration

6-Applications of Integration

7-Integration Techniques

8-Sequences and Infinite Series

9-Power Series

10-Parametric and Polar Curves

11-Vectors and Vector-Valued Functions

12-Functions of Several Variables

13-Multiple Integration

14-Vector Calculus

-

2-Mathematical Modeling

1-Data Analysis

2-Spreadsheet Modeling

3-Elements of a Decision Analysis

4-Risk andDecision Strategies

5-Statistical Modeling

6-Simple Additive Weighting

7-Multi-Criteria Decision Making

8-Decision Making with Uncertainty

9-Optimization Modeling

10-Simulation Modeling

-

3-Computer Graphics: Principles and Practice

1-Introduction

2-Introduction to 2D Graphics using WPF

3-Chapter 3 solutions

4-A 2D graphics testbed

5-An introduction to human visual perception

6-Introduction to Fixed-Function 3D Graphics and Hierarchical Modeling

7-Essential mathematics and the geometry of 2-space and 3-space: solutions

8-A simple way to describe shape in 2D and 3D

9-Functions on meshes

10-Transformations in two dimensions

11-Transformations in three dimensions

12-A 2D and 3D transformation library for graphics

13-Camera Specifications and Transformations

14-Standard approximations and representations

15-Raycasting and Rasterization

16-Survey of 3D Real-time Graphics Platforms

17-Image representation and manipulation

18-Images and signal processing

19-Enlarging and shrinking images

20-Textures and Texture Mapping

21-Interaction techniques

22-Splines and Subdivision Curves

23-Splines and Subdivision Surfaces.

24-Implicit representations of shape

25-Meshes

26-Light

27-Materials and Scattering

28-Color

29-Light transport

30-Probability and Monte Carlo Integration

31-Computing Solutions to the Rendering Equation: Theoretical Approaches

32-Rendering in practice..

33-Shaders

34-Expressive Rendering ..

35-Motion

36-Visibility Determination

37-Spatial Data Structures

38-Modern Graphics Hardware

-

4-Costing Related Topics

1-Multi-Criteria Decision Making

2-Decision Making with Uncertainty

3-Optimization Modeling

4-Simulation Modeling

5-Data Analysis

6-Spreadsheet Modeling

7-Elements of a Decision Analysis

8-Risk and  Decision Strategies

9-Statistical Modeling

10-Simple Additive Weighting

11-Costing Methodology

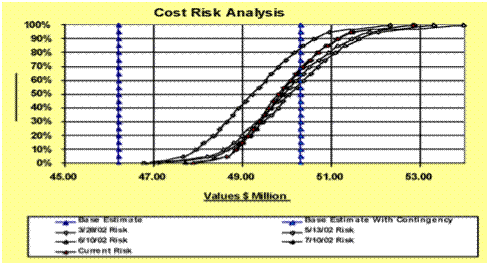
12-Cost Risk Analysis

13-Range Estimating

14-Chaos Theory

-

5-Exercise pdf

1-DEMAND FUNCTIONS

2-SUPPLY FUNCTIONS

3-EQUILIBRIUM PRICES

4-LABOR MARKETS

5-ELASTICITY OF DEMAND

6-CONSUMER & PRODUCER SURPLUS

7-TAXES AND WELFARE

8-MARGINAL COSTS

9-PROFIT MAXIMIZATION

10-UTILITY MAXIMIZATION

11-MORE UTILITY MAXIMIZATION

12-DEMAND CURVES AND INCOME

13-DISCOUNTED PRESENT VALUE

14-INTERNAL RATE OF RETURN

-

_____________________

-Probability & Statistics Topics:


1-Statistics for Business and Economics

2-Probability & Statistics for Engineers & Scientists

3-Statistics for Business Decision Making & Analysis

4-Regression Analysis Case Studies

5-Regression Analysis (2nd Course in Statistics)

A-FUNDAMENTALS OF ENGINEERING - HANDBOOK

B-Predictive Analytics Symposium -

C-�Army Cost Management and Financial Transparency�

D-Business Analytics for Decision-Making

-

-

1-Statistics for Business and Economics

1-Describing Data: Graphical

2-Describing Data: Numerical

3-Probability

4-Random Variable, Probability Distributions

5-Continuous Variables and Distributions

6-Sampling & Sampling Distributions

7-Estimation: Single Population

8-Estimation

9-Hypothesis Testing

10-More on Hypothesis Testing

11-Simple Regression

12-Multiple Regression

13-More on Regression Analysis

14-Analysis of Categorical Data

15-Analysis of Variance

16-Time-Series Analysis and Forecasting

17-Additional Topics in Sampling

18-Statistical Decision Theory

-

2-Probability & Statistics for Engineers & Scientists

1-Introduction to Statistics and Data Analysis

2-Probability

3-Random Variables and Probability Distributions

4-Mathematical Expectation

5-Some Discrete Probability Distributions

6-Some Continuous Probability Distributions

7-Functions of Random Variables

8-Sampling, Distributions Data Descriptions

9-One and Two-Sample Estimation Problems

10-One and Two-Sample Tests of Hypotheses

11-Simple Linear Regression and Correlation

12-Multiple Linear Regression & Nonlinear Models

13-One-Factor Experiments: General

14-Factorial Experiments (Two or More Factors)

15-2k Factorial Experiments and Fractions

16-Nonparametric Statistics

17-Statistical Quality Control

18-Bayesian Statistics

-

-Cost Analysis & Management Application Topics:


1-Principles of Cost Analysis and Management  (PCAM)

2-Intermediate of Cost Analysis and Management  (ICAM)

-

-

1-Principles of Cost Analysis and Management  (PCAM)

1-Introduction to Principles of Cost Analysis and Management

2-Determine the Difference between Internal and External Cost Reporting

3-Calculate Financial Position

4-Explain Change in Financial Position over a Period of Time

5-Calculate Unobligated Balance

6-Define Governmental Operating Activities

7-Explain Changes in Net Position over a Period of Time

8-Determine Diff Acct Methods

9-Demonstrate How Trans Affect Acct Equation

10-Complete Steps 1-3 in Acct Cycle

11-Prepare Income Statement

12-Complete all Steps in Acct Cycle

13-Calculate Cost of Goods Manufactured

14-Calculate Cost of Goods Sold

15-the Difference between Internal and External Cost Reporting

16-Explain the Impact of Poor Cost Information

17-Recommend Course of Action in Outsourcing

18-Determine the Purpose and Motivation for Managerial Costing

19-Calculate Total Cost per Unit Cost

20-Calculate Total Cost and Incremental Costs

21-Verify Unit of Measures in a Multivariate Equation

22-Determine the Fixed & Variable Components

23-Calculate Present or Future Value

24-Recommend Investment Course of Action

25-Calculate Probability of a Given Outcome

26-Calculate Expected Values of Alternative Courses of Action

27-Allocate Single Cost Pool to Users

28-Calculate Cost of a Service Job with Single Cost

29-Calculate Cost of a Service Job with Multiple Costs

30-Identify Common Errors in Activity Based Costing (ABC) Planning

31-Calculate Break Even Point

32-Identify Sensitive Variables

33-Calculate Point of Indifference between Two Cost Scenarios

34-Point of Indifference between Two Diff Multi-period Cost Scenarios

35-Calculate Economic Order Quantity

36-Calculate a Production Plan with the Inventory Chain Template

37-Project Sales or Production Levels

38-Projected Costs with the Cumulative Average Learning Curve

39-Estimate Future Costs Given Planning Factors

40-Perform Cost Benefit Analysis

41-Calculate Volume and Performance Variances

42-Calculate Spending and Efficiency Variances

43-Explain Causes of Variances Using the Reconciliation Format

44-Similarities between Battlefield Management and Cost Management

45-Identify the Steps in an After Action Review

46-Prepare a Forecast, Variance, and Reconciliation Briefing

47-Perform an AAR Briefing

48-Closing Remarks

-

2-Intermediate of Cost Analysis and Management  (ICAM)

1-Determine the Difference Between Internal and External Report

2-Calculate Financial Position and Net Change in Financial Position

3-Demonstrate How Transactions Affect the Accounting

4-Explain the Impact of Poor Cost Information

5-Calculate Total Cost and Per-Unit Cost Given Production

6-Determine Unit of Measure in a Multivariate Equation

7-Calculate Present or Future Value of a Variety of Cash Flow

8-Recommend Investment Course of Action Based on NPV Calculation

9-Calculate Expected Values of Alternative Courses of Action

10-Recommend A Course of Action in Outsourcing and Keep or Replace

11-Allocate Single Cost Pool to Users

12-Calculate Cost of Service with Multiple Cost Pools Drivers

13-Describe Common Pitfalls in Activity Based Costing and Ways

14-Calculate Breakeven Point in Units and Revenue Dollars

15-Identify Sensitive Variables through What-if Scenarios

16-Calculate Point of Indifference Between Two Different Cost S

17-Calculate Economic Order Quantity for Various Situations

18-Calculate a Production Plan with the Inventory Chain Template

19-Project Sales or Production Levels Using the Rolling Average

20-Estimate Future Costs Given Planning Factors

21-Determine the Motivation and Purpose for Cost Benefit Analysis

22-Perform Army Cost Benefit Analysis

23-Apply Army Cost Benefit Analysis to a Simple Scenario

24-Apply Army Cost Benefit Analysis to a Complex Scenario

25-Calculate Volume and Performance Variances

26-Calculate Spending and Efficiency Variances

27-Explain Causes of Variances with the Reconciliation Format

28-Similarities between Battlefield Management and Cost Management

29-Identify the steps in the AAR

30-Prepare a Forecasts, Variances And Reconciliation Briefing

31-Demonstrate After Action Review Proficiency

32-Determine the Purpose and Motivation for Continuous Improve

33-Apply DMAIC (Define, Measure, Analyze, Improve, Control) to

34-Calculate Projected Costs with the Cumulative Average Learn

35-Identify Relevant Components of Information from a Real World Scenario

36-Determine the Purpose and Motivation for Leadership Driven

37-Determine the Implementation Requirements for Cost Management

38-Calculate Schedule and Cost Variances with Earned Value Analysis

39-Apply Earned Value Management Principles to Corps of Engine

40-Define Characteristics of Organization Based Control

41-Explain Variances Between Actual (AMCOS) and Expected (FORCES)

42-Identify the Characteristics of a Cost Managed Organization

43-Determine Cause of Variances Between Expected and Actual

44-Determine the Purpose and Characteristics of Role Based Cos

45-Identify Pitfalls in a Role Based Control Case Study Scenario

46-Apply Role-Based Cost Control Principles to a Real World Scenario

47-Determine Purpose and Characteristics of Output Based Cost

48-Identify Key Elements of Information from Output Based Case

49-Calculate Volume and Performance Variances for Output-Based

50-Determine Motivation for and Characteristics of Change Management

51-Apply Change Management Theory to Case Study (Gunfire at Sea Case Study)

52-Identify Key Factors that Impact Effective Change Efforts

-

_______________________________________

3-Statistics for Business Decision Making & Analysis

1-Introduction

2-Data

3-Describing Categorical Data

4-Describing Numerical Data

5-Association between Categorical Variables

6-Association between Quantitative Variables

7-Probability

8-Conditional Probability

9-Random Variables

10-Association between Random Variables

11-Probability Models for Counts

12-The Normal Probability Model

13-Samples and Surveys

14-Sampling Variation and Quality

15-Confidence Intervals

16-Statistical Tests

17-Alternative Approaches to Inference

18-Comparison

19-Linear Patterns

20-Curved Patterns

21-The Simple Regression Model

22-Regression Diagnostics

23-Multiple Regression

24-Building Regression Models

25-Categorical Explanatory Variables

26-Analysis of Variance

27-Time Series

-

4-Regression Analysis Case Studies

1-Legal Advertising- Does it Pay?

2-Modeling the Sale Prices of Properties

3-Deregulation of the Intrastate Trucking Industry

4-An Analysis of Rain Levels in California

5-Factors Affecting Sale Price at Public Auction

6-Modeling Daily Peak Electricity Demands

7-Reluctance to Transmit Bad News: MUM Effect

-

5-Regression Analysis (2nd Course in Statistics)

1-A Review of Basic Concepts

2-Introduction to Regression Analysis

3-Simple Linear Regression

4-Multiple Regression Models

5-Principles of Model Building

6-Variable Screening Methods

7-Some Regression Pitfalls

8-Residual Analysis

9-Special Topics in Regression

10-Time Series Modeling and Forecasting

11-Principles of Experimental Design

12-Analysis of Variance for Designed Experiments

-

A-FUNDAMENTALS OF ENGINEERING - HANDBOOK

B-Predictive Analytics Symposium -

C-�Army Cost Management and Financial Transparency�

D-Business Analytics for Decision-Making